
News
Temporary setup of homepage (Apr 19, 2021).
Data in 2015 uploaded (Jun 18, 2017).
Data in 2014 uploaded (May 19, 2016).
We participate in the offical TROPOMI validation program, NIDFORVAL, lead by Corinne Vigouroux and Gaia Pinardi (BIRA, Belgium).
Our data were heavily used in MACC-III Project Report D15.2 by Philipp Schneider, NILU (Norway).
Background and Aims
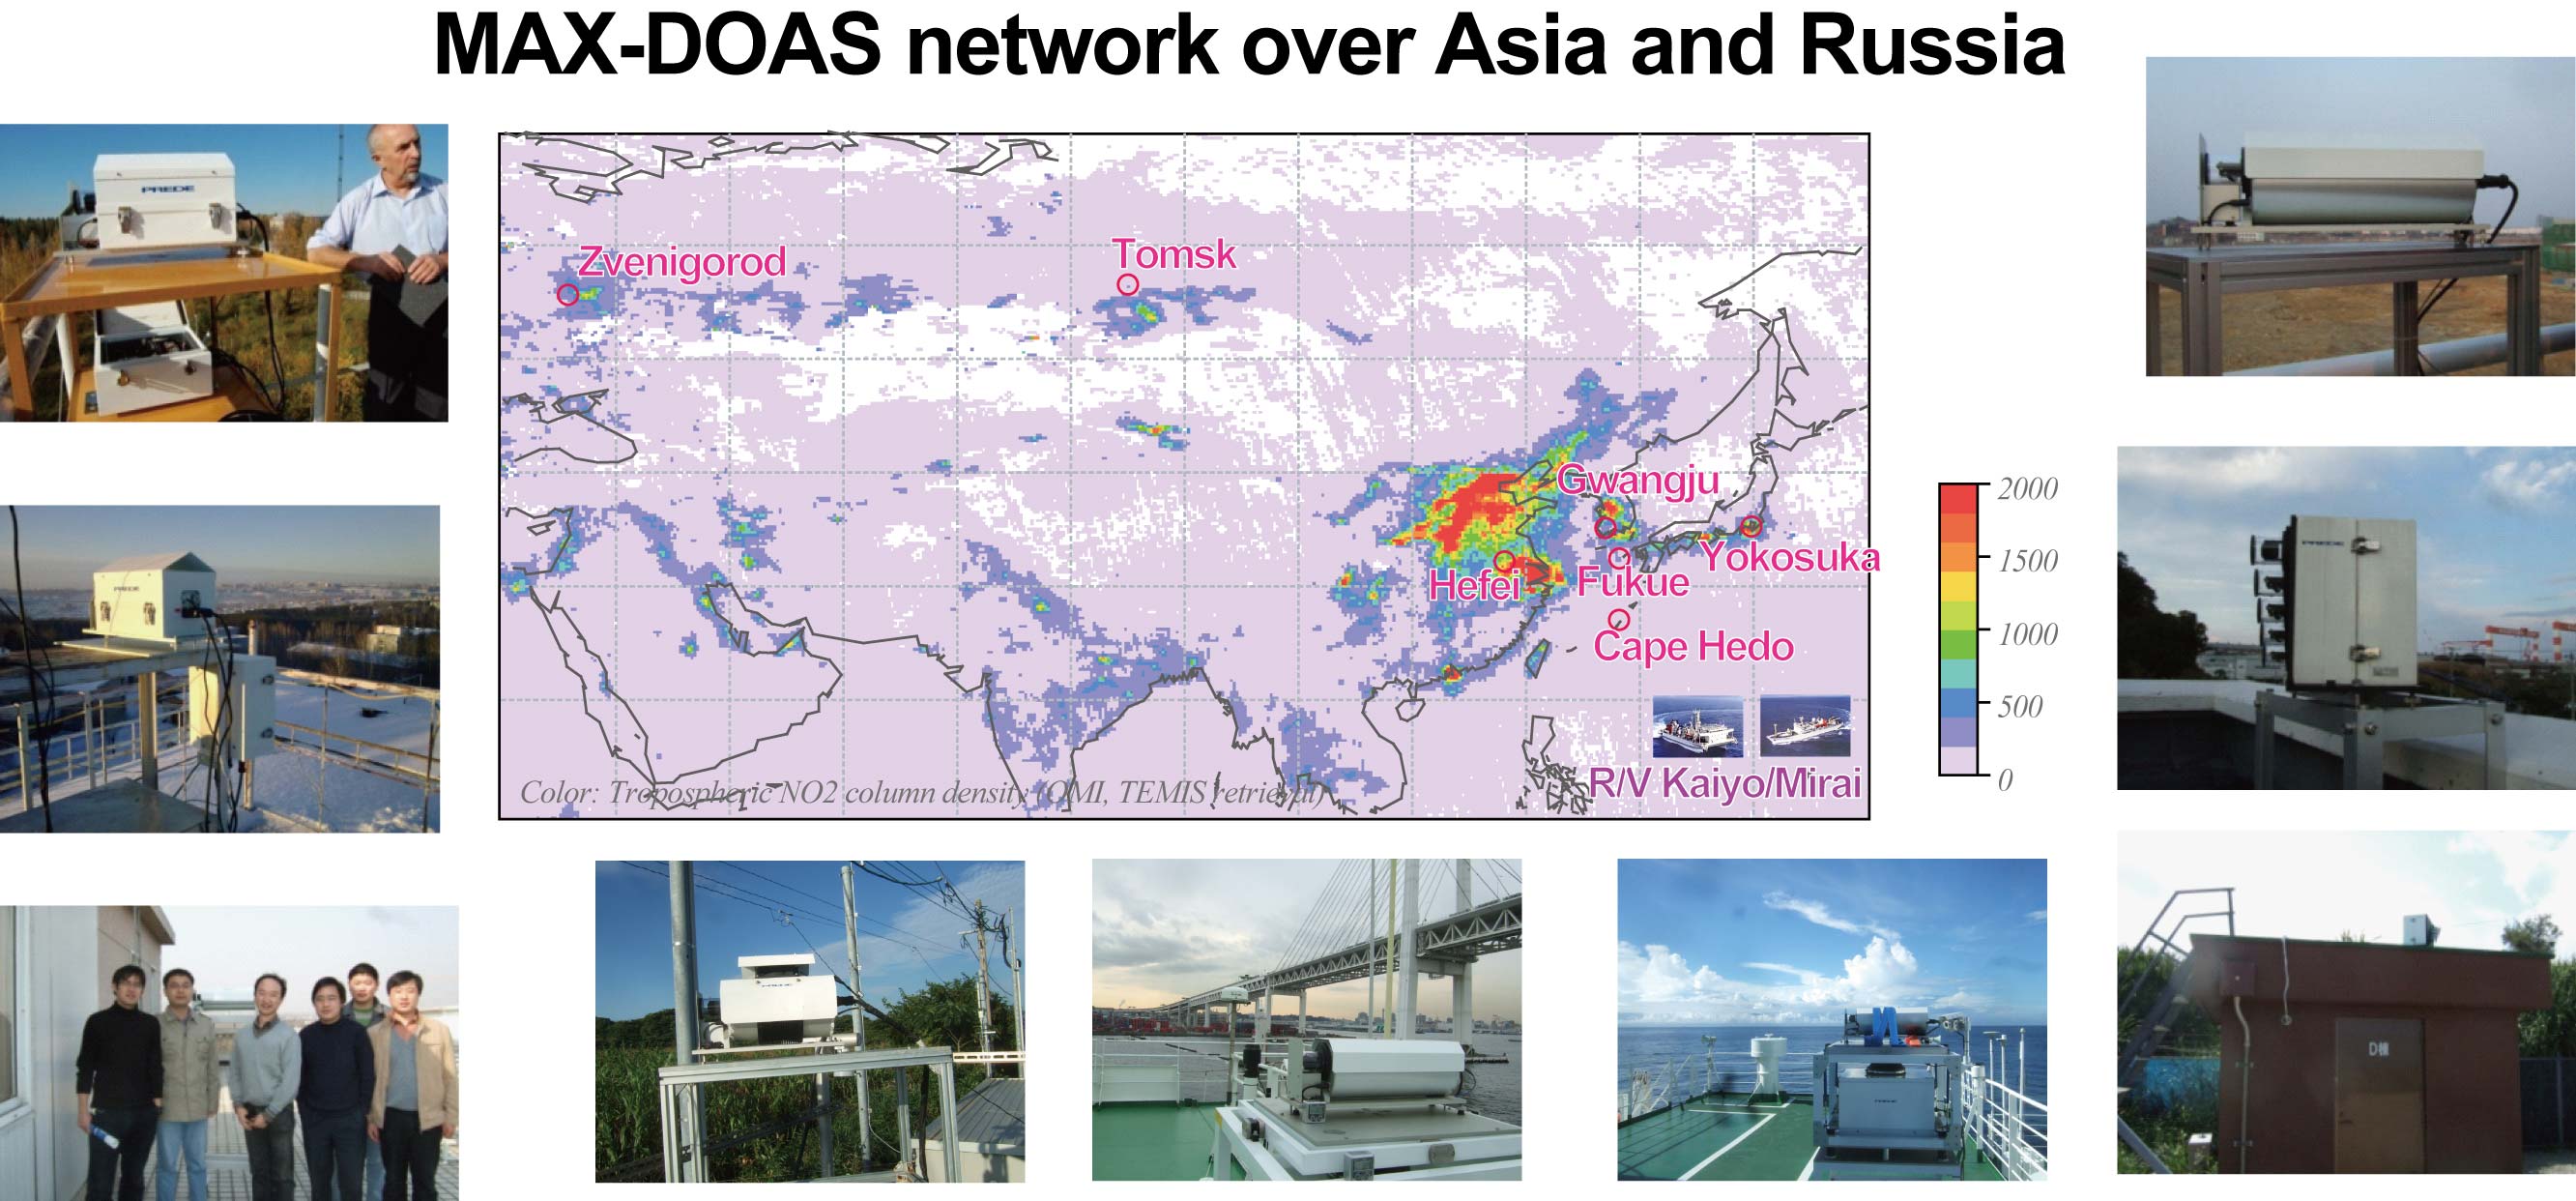
Air quality change in Asia and surrounding regions is paid attention because of the rapid and substantial increase in the human activity in this region. We have established a long-term MAX-DOAS (Multi-Axis Differential Optical Absorption Spectroscopy) monitoring network over Asia and Russia regions to provide vertically-resolved (or integrated) NO2 densities and aerosol extinction, as mainly supported by the Japan EOS (Earth Observation System) Promotion Program of the Ministry of Education, Culture, Sports, Science and Technology (MEXT).
Our aims are 1) to validation satellite observations and chemical transport models with respect to tropospheric NO2 and aerosols and 2) to observe diurnal variations and vertical distributions beyond the capabilities of current orbiting satellite sensors.
This project is achieved by international collaboration between JAMSTEC, Gwangju Institute of Science and Technology (GIST), Korea , Anhui Institute of Optics and Fine Mechanics (AIOFM), China, Institute of Atmospheric Physics, Russia, and Institute of Atmospheric Optics, Russia. Although the initial grant expired in 2011, JAMSTEC continues the observations. See details in the overview paper (Kanaya et al., ACP, 2014).
General principle
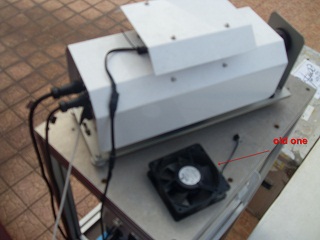
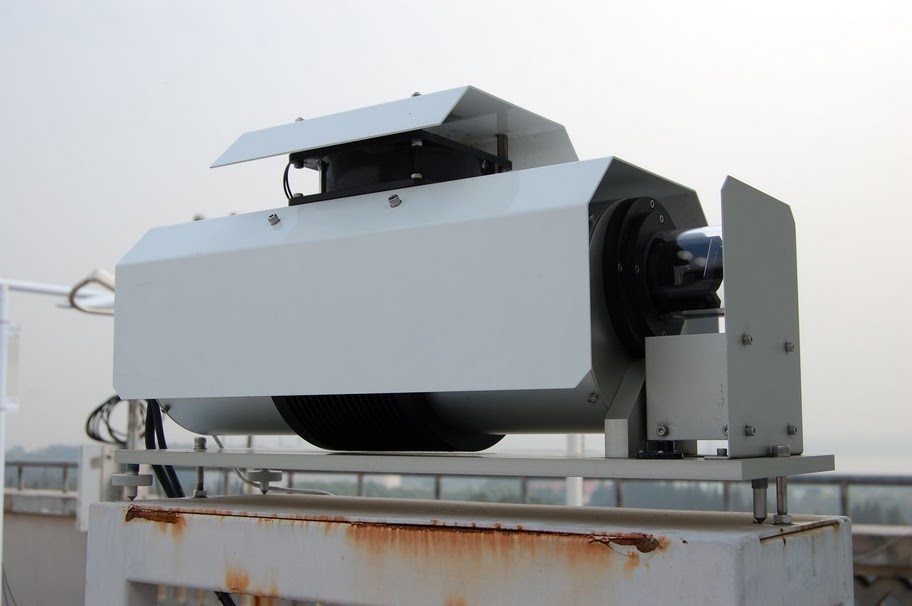
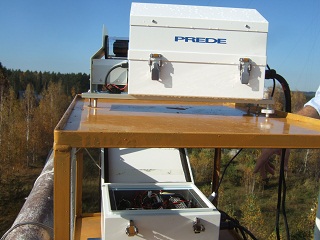
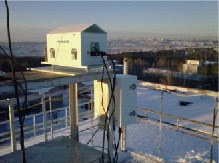
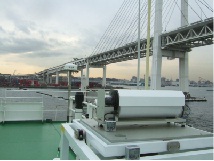
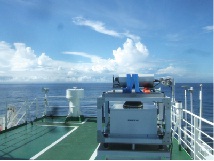
We use standardized MAX-DOAS instruments developed under cooperation with Prede co., ltd. Scattered sunlight (with wavelength between 300 and 550 nm) at 6 elevation angles (3, 5, 10, 20, 30, and 90 (sometimes 70) degrees) is received sequentially by a rotating mirror and then delivered to a temperature-regulated spectrometer (USB4000) by a bundle of optical fibers. A set of measurements at the 6 angles takes 30 minutes. A single algorithm comprising of DOAS spectral fitting and inversion to yield vertical column densities (VCDs) from slant columns is applied for all of the spectra and thus provided a systematic data set. Observations of an O4 band at 476 nm provided optical path information (and thus aerosol extinction) and then this information is employed in the NO2 retrieving process (460-490nm). In the case of ship-borne observations, we use an active gimbal system to stabilize the light-receiving device located on top of it, which compensates for the roll and pitch motions of the research vessels.
Data set
|
site (latitude, longitude)
|
surface and instrument elevation (m, asl)
|
azimuth angle (N=0, E=90)
|
operation period
|
instrument no.
|
year
|
figures, recommendations
|
Yokosuka (35.32N, 139.65E)
|
0 m and 10 m
|
+37.00
|
From April 2007
|
1
|
2007 2008 2009 2010 2011 2012 2013 2014 2015 2016 2017 2018 2019 2020 2021
|
CI < 1.67 is recommended for AOD and extinction profile.
|
Cape Hedo (26.87N, 128.25E)
|
0 m and 68 m
|
-14.00
|
From March 2007
|
1
|
2007 2008 2009 2010 2011 2012 2013 2014 2015 2016 2017 2018 2019 2020
|
CI < 2.4 is recommended for AOD and extinction profile.
|
Fukue (32.75N, 128.68E)
|
80 m and 86 m
|
+30.00
|
From Feb 2009
|
1
|
---- ---- 2009
|
CI < 0.81, 2.41, and 1.55 (for instrument 1, 2, and 3) are recommended for AOD and extinction profile.
|
|
2
|
---- ---- 2009 2010 2011 2012
|
|
3
|
---- ---- ---- ---- ---- 2012 2013 2014 2015 2016 2017 2018 2019 2020 2021
|
Gwangju (35.23N, 126.84E)
|
30 m and 43 m
|
+44.00
|
From Feb 2008
|
1
|
---- 2008 2009
|
CI < 2.20, 2.1, and 2.02 (for instrument 1, 2, and 3) are recommended for AOD and extinction profile.
|
|
2
|
---- ---- 2009 2010
|
|
3
|
---- ---- ---- ---- 2011 2012 2013 2014 2015 2016 2017 2018 2019 2020 2021
|
Hefei (31.91N, 117.16E)
|
30 m and 51 m
|
+22.00
|
From Mar 2008
|
1
|
---- 2008 2009
|
CI < 1.74 and 2.01 (for instrument 1 and 2) are recommended for AOD and extinction profile.
|
|
2
|
---- ---- ---- 2010 2011 2012 2013 2014 2015
|
Zvenigorod (55.70N, 36.78E)
|
186 m and 208 m
|
-32.00
|
From Oct 2008
|
1
|
---- 2008 2009 2010 2011 2012 2013 2014 2015
|
CI < 1.57 is recommended for AOD and extinction profile. Also, large errors are expected for wintertime data (November - March), because of the difference in surface albedo.
|
Tomsk (56.48N, 85.05E)
|
160 m and 188 m
|
0.00
|
From Jan 2009
|
1
|
---- ---- 2009 2010 2011 2012 2013 2014 2015
|
Quicklook figures
CI < 2.7 is tentatively recommended for AOD and extinction profile.
|
R/V Kaiyo
|
0 m and 25 m
|
undefined (+90 deg wrt heading)
|
Jul 2008 and Feb-May 2009
|
1
|
---- 2008 2009 ---- ----
|
Quicklook figures
CI < tbd is recommended for AOD and extinction profile.
|
R/V Mirai
|
0 m and 25 m
|
undefined (+90 deg wrt heading)
|
2010, 2011, 2012
|
1
|
---- ---- ---- 2010 2011 2012 2013 2014 2015
|
Quicklook figures
CI < tbd is recommended for AOD and extinction profile.
|
Error codes
Error codes: 8 digits; expressed as sum of them:
10000000=wrong mirror operation, incl power blackout
1000000 =integration time or temperature shifted
100000 =aerosol retrieval unsuccessful
10000 =fitting residual >5e-3
1000 =large stray light or spectrometer T anomaly 1
100 =spectrometer T anomaly 2
10 =raw signal >60000 in visible wavelength range
1 =NO2vcd retrieval failed
Data owners
For Japanese sites (and R/V data), researchers located at JAMSTEC (Yugo Kanaya, Hitoshi Irie, Hisahiro Takashima) are the owners for the data.
For Korean site: Yugo Kanaya, Hitoshi Irie, Hisahiro Takashima, M. Gu, J. Chong, Y.J. Kim, H. Lee
For Chinese site: Yugo Kanaya, Hitoshi Irie, Hisahiro Takashima, A. Li, S. Fu, J. Xu, P.-H. Xie, W.-Q. Liu
For Zvenigorod (Russia): Yugo Kanaya, Hitoshi Irie, Hisahiro Takashima, O. Postylyakov, A. Dzhola, E. Grechko
Data policies
Data users need to consent to the followings:
Upon downloading, please report to JAMSTEC researchers about the purpose of the data usage. This is to avoid possible overlaps of research scopes. Otherwise priority might not be provided to the data user for the pertinent analysis. We will do our best to assist data users by providing further information necessary for the analysis.
Whenever the data are to be used for any publications or presentations, please report to JAMSTEC researchers in advance. Co-authorship should be provided to the data owners.
Please include reference Kanaya et al. (2014).
More details of algorithm, current limitations, and recommendations
See details in (Kanaya et al., ACP, 2014), providing overview information. The NO2 and aerosol (at 476nm) retrieval algorithm is similar to that of JM1 (Irie et al., 2011), but (1)QDOAS software ver 2.00 is used for DOAS analysis and (2) conversion from DSCDs to vertical quantities was made by a newly-coded program. Details are found at the reference (Kanaya et al., ACP, 2014). More detailed background information is found in Irie et al. (ACP 2008a) and (ACP 2008b). The data set in this web page is still under development and can be subject to revision in the future. The code is built at the best-effort basis, including our experience of joining the MAX-DOAS intercomparison field campaign CINDI. Our observation and the retrieval algorithm have been evaluated during the camapign (see Roscoe et al., AMT, 2010). Our differential slant column densities (DSCDs) of NO2 agreed well with those derived from independent instruments/algorithms developed by other research groups. A radiative transfer model MCARaTS (Iwabuchi, JAS, 2006), employed in the step converting DSCDs to VCDs, has also been validated during the intercomparison for box-air-mass-factors for MAX-DOAS (Wagner et al., ACP, 2007). However, uncertainties in retrieving vertical profiles and vertically integrated amounts and in deriving aerosol parameters from measurements of O4 optical depths have not yet been fully evaluated. It is also natural that additional errors arise from the instability of the running conditions of the instruments, and from uncertainties in other input parameters (e.g., ground surface albedo etc.) Therefore it is fully recommended that researchers, who are to use the dataset, contact Dr. Yugo Kanaya.
Cloud screening poses another issue. The data set provided here should have survived "light" cloud screening, because of the criteria of AOD < 3 we employed in the retrieval algorithm and also because of the good agreement criteria in O4 optical depths at multiple elevation angles with those in the radiative transfer model. Takashima et al. (JGR 2009) focused on the comparison of the MAX-DOAS aerosol products with Mie Lidar at Cape Hedo and suggested that the criteria with the MAX-DOAS color index (CI), defined as the ratio of the intensities at 500 and 380 nm, being < 1.5 (2.4 in current scale), can be used for "specific" cloud screening there. Since the threshold values can change with respect to the performance of each spectrometer used at different locations, we provide recommended ratio values for each site and instrument. The CI values for each observations are given in the aerosol data set. For NO2, strict cloud screening is not necessary because the optical paths, no matter whether aerosols or clouds have dominant roles in their determination, have been taken into account.
Publications
Kanaya, Y., Irie, H., Takashima, H., Iwabuchi, H., Akimoto, H., Sudo, K., Gu, M., Chong, J., Kim, Y. J., Lee, H., Li, A., Si, F., Xu, J., Xie, P.-H., Liu, W.-Q., Dzhola, A., Postylyakov, O., Ivanov, V., Grechko, E., Terpugova, S., and Panchenko, M.: Long-term MAX-DOAS network observations of NO2 in Russia and Asia (MADRAS) during the period 2007-2012: instrumentation, elucidation of climatology, and comparisons with OMI satellite observations and global model simulations, Atmos. Chem. Phys., 14, 7909-7927, doi:10.5194/acp-14-7909-2014, 2014.
Irie, H., Takashima, H., Kanaya, Y., Boersma, K. F., Gast, L., Wittrock, F., Brunner, D., Zhou, Y., and Van Roozendael, M.: Eight-component retrievals from ground-based MAX-DOAS observations, Atmos. Meas. Tech. Discuss., 4, 639-690, doi:10.5194/amtd-4-639-2011, 2011.
Roscoe, H. K.., Van Roozendael, C. Fayt, A. du Piesanie, N. Abuhassan, C. Adams, M. Akrami, A. Cede, J. Chong, K. Clemer, U. Friess, M. Gil Ojeda, F. Goutail, R. Graves, A. Griesfeller, K. Grossmann, G. Hemerijckx, F. Hendrick, J. Herman, C. Hermans, H. Irie, P. V. Johnston, Y. Kanaya, K. Kreher, R. Leigh, A. Merlaud, G. H. Mount, M. Navarro, H. Oetjen, A. Pazmino, M. Perez-Camacho, E. Peters, G. Pinardi, O. Puentedura, A. Richter, A. Schonhardt, R. Shaiganfar, E. Spinei, K. Strong, H. Takashima, T. Vlemmix, M. Vrekoussis, T. Wagner, F. Wittrock, M. Yela, S. Yilmaz, F. Boersma, J. Hains, M. Kroon, and A. Piters, Intercomparison of slant column measurements of NO2 and O4 by MAX-DOAS and zenith-sky UV and visible spectrometers, Atmos. Meas. Tech., 3, 1629-1646 (2010).
Lee, H., H. Irie, J. Ryu, Y. Kanaya, Y. Noh, Y. J. Kim, S. Kwon, M. Trail, A. G. Russell, gLower tropospheric aerosol measurements by MAX-DOAS during severe Asian dust periodh, Aerosol Sci. Tech., 43 (12), 1208-1217 (2009).
Irie, H., Y. Kanaya, H. Takashima, J. F. Gleason, and Z. Wang, gCharacterization of OMI tropospheric NO2 measurements in East Asia based on a robust validation comparisonh, SOLA, 5, 117-120 (2009).
Takashima, H., H. Irie, Y. Kanaya, A. Shimizu, K. Aoki, and H. Akimoto, gAtmospheric aerosol variations at Okinawa Island in Japan observed by MAX-DOAS using a new cloud-screening methodh, J. Geophys. Res., 114, D18213, doi:10.1029/2009JD011939. (2009).
Irie, H., Y. Kanaya, H. Akimoto, H. Iwabuchi, A. Shimizu, and K. Aoki, gDual-wavelength aerosol vertical profile measurements by MAX-DOAS at Tsukuba, Japanh, Atmos. Chem. Phys. 9, 2741-2749 (2009).
Irie, H., Y. Kanaya, H. Akimoto, H. Tanimoto, Z. Wang, J. F. Gleason, and E. J. Bucsela, gValidation of OMI tropospheric NO2 column data using MAX-DOAS measurements deep inside the North China Plain in June 2006h, Atmos. Chem. Phys, 8, 6577-6586 (2008).
Inomata, S., H. Tanimoto, S. Kameyama, U. Tsunogai, H. Irie, Y. Kanaya, and Z. Wang, gTechnical Note: Determination of formaldehyde mixing ratios in air with PTR-MS: Laboratory experiments and field measurementsh, Atmos. Chem. Phys., 8, 273-284 (2008)
Irie, H., Y. Kanaya, H. Akimoto, H. Iwabuchi, A. Shimizu, and K. Aoki, gFirst retrieval of tropospheric aerosol profiles using MAX-DOAS and comparison with lidar and sky radiometer measurementsh, Atmos. Chem. Phys., 8, 341-350 (2008)
Wagner, T., J. P. Burrows, T. Deutschmann, B. Dix, C. von Friedeburg, U. Fries, F. Hendrick, K.-P. Heue, H. Irie, H. Iwabuchi, Y. Kanaya, J. Keller, C. A. McLinden, H. Oetjen, E. Palazzi, A. Petritoli, U. Platt, O. Postylyakov, J. Pukite, A. Richter, M. van Roozendael, A. Rozanov, V. Rozanov, R. Sinreich, S. Sanghavi, and F. Wittrock, gComparison of box-air-mass-factors and radiances for multiple-axis differential optical absorption spectroscopy (MAX-DOAS) geometries calculated from different UV/visible radiative transfer modelsh, Atmos. Chem. Phys., 7, 1809-1833 (2007).
Links
JAMSTEC/RIGC/EBCRP Atmospheric Composition Research Team homepage
Key Laoratory of Environment Optics & Technology, CAS
GEMS and GOSAT-GW Validation (GnGVal) data homepage
go to old data set page
|